Search This Blog

Thursday

Advanced Price Movement Predictor Pro Edition MT4


Advanced Price Movement Predictor Pro Edition MT4 | MetaTrader 4 | Forex Indicator | MQL - MQL4 | Custom Indicator [Online Code]

 Most of the classic indicators that make up the common trading strategies are based on simple math, not because when these indicators were created there were no outstanding mathematicians (in fact there were probably best mathematicians then than now), but because computers did not exist or they simply had a low processing power to perform complex mathematical operations consistently. Nowadays, any smartphone surpasses overwhelmingly the most powerful computer just a few decades ago. So the ability to process huge amounts of information is not a limitation in these days, except for extremely complex process simulations.

Advanced Price Movement Predictor (APMP) indicator takes advantage of current processing capacity to capture the essence of price swings through some of the most advanced mathematical, statistical and probabilistic concepts.

APMP does not provide a prediction itself, since the price movement is a non-stationary stochastic process and therefore it is not predictable. However, it makes a dynamic and highly reliable estimation of the immediate price movement.

Based on the same analysis, APMP displays the current real trend of the market. Why real trend? Is not real the trend obtained with other indicators? So far the trend is almost always obtained from classic indicators like Moving Averages, Bollinger Bands or Parabolic SAR, or simply by the traditional method of manually drawing a line (or two parallel lines) between two or more significant points.

Obviously, those indicators and methods are still valid, especially since they are used by most of the traders, but do most of them obtain sustained profits? We have the intuition that they do not. With this indicator you can strengthen or improve your current trading method, or you can simply dismiss it because you will see that even the most chaotic behavior, such as the market price, respects the large numbers and is limited to the rigor of the all powerful mathematical laws.

How to Use It

Basically, the use of APMP is not different from how you regularly use trends, and support and resistance levels. The fundamental difference is in the reliability and robustness of those values calculated by this indicator.

Regular use of APMP is as follows:

For trading strategies based on the trend, traders must buy in areas near the support levels while the trend is up, and sell in areas close to the resistance levels while the trend is down.

For trading strategies based on trend corrections (counter trend), traders must buy in areas near the support levels while the trend is down, and sell in areas near the resistance levels while the trend is up.

Notice that significant levels can act either as supports or resistances, so it is important to keep that in mind when designing our trading strategy and pay special attention to the price behavior whenever it is close to those levels.

The Stop Loss could be located at a distance from the open price equal to the separation between the support and the resistance levels, and Take Profit distance could be twice the previous separation. Also, it would be a good idea to use a Trailing Stop feature to move the Stop Loss when support and resistance levels are moving in favor of the position.

The strategy outlined above is only a basic suggestion, but APMP provides enough information to create a variety of trading strategies and improve the existing ones.

It will be interesting to hear about different strategies derived from this indicator.

Saturday

Forex Trading Secret Revealed: How to Trade Forex Successfully with Secret Strategies and Indicators


Forex Trading Secret Revealed: How to Trade Forex Successfully with Secret Strategies and Indicators Been trading now for many years and have tried trading off all time frames but have finally found the secret of making real money trading the forex markets. You’re about to learn what most traders never know about trading. You can be wrong 50% of the time and still make loads money! In this course you’ll discover specific step-by-step trading money management strategies, used by successful traders, that you can literally drop into your current trading system and see immediate profit increasing results.

Sunday

How to Profit with Forex Trading: How I made $26725.09 in One Week Using Forex Technical Indicators


How to Profit with Forex Trading: How I made $26725.09 in One Week Using Forex Technical Indicators

 For many forex traders (or any type of trader, for that matter), long gone are the hopes of making millions of dollars overnight, and all they wish to do now is stop losing money and begin to turn their trading accounts around. There are many mistakes that traders make that contribute to getting themselves into this situation, and this book is going to cover the top technical analysis indicators that can turn their accounts and performance around!

Friday

Sentiment in the Forex Market: Indicators and Strategies To Profit from Crowd Behavior and Market Extremes (Wiley Trading)


Sentiment in the Forex Market: Indicators and Strategies To Profit from Crowd Behavior and Market Extremes (Wiley Trading)
Jamie Saettele

 Crowds move markets and at major market turning points, the crowds are almost always wrong. When crowd sentiment is overwhelmingly positive or overwhelmingly negative ? it's a signal that the trend is exhausted and the market is ready to move powerfully in the opposite direction. Sentiment has long been a tool used by equity, futures, and options traders.

In Sentiment in the Forex Market, FXCM analyst Jaime Saettele applies sentiment analysis to the currency market, using both traditional and new sentiment indicators, including: Commitment of Traders reports; time cycles; pivot points; oscillators; and Fibonacci time and price ratios. He also explains how to interpret news coverage of the markets to get a sense of when participants have become overly bullish or bearish. Saettele points out that several famous traders such as George Soros and Robert Prechter made huge profits by identifying shifts in crowd sentiment at major market turning points. Many individual traders lose money in the currency market, Saettele asserts, because they are too short-term oriented and trade impulsively. He believes retail traders would be much more successful if they adopted a longer-term, contrarian approach, utilizing sentiment indicators to position themselves at the beginning points of major trends.

Sunday

MACD with Histogram - indicator for MetaTrader 5

This forex-indicator modifies the original MACD.mq5 from MetaTrader 5 Indicators/Examples folder.
It presents MACD Main and Signal in Lines Style, and includes the MACD Histogram in visualization.
Periods of EMA Fast, EMA Slow and Signal are freely customizable, as well as applied price.

Input parameters:

input int                InpFastEMA=12;               // Fast EMA period
input int                InpSlowEMA=26;               // Slow EMA period
input int                InpSignalSMA=9;              // Signal SMA period
input ENUM_APPLIED_PRICE InpAppliedPrice=PRICE_CLOSE; // Applied price

Download forex-indicator

Tuesday

MACD with Histogram - indicator for MetaTrader 5

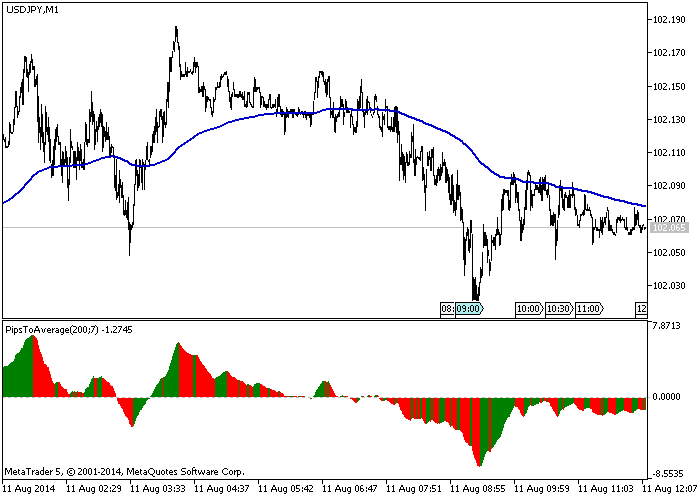
This forex indicator measures the (smoothed) distance in pips between the close and an exponential moving average.
The first input, Period_Average, is the period of the exponential moving average. The forex indicator first computes an array containing the difference between this average and the corresponding close price. Then, it computes an smoothed moving average with period Period_PipsToAv (the second input) of this array.
Here you can show an image with this indicator with parameters 200 and 7, as well as the 200-exponential moving average:

indicator


Download forex-indicator

Sunday

MACD and Volumes - forex indicator for MetaTrader 4

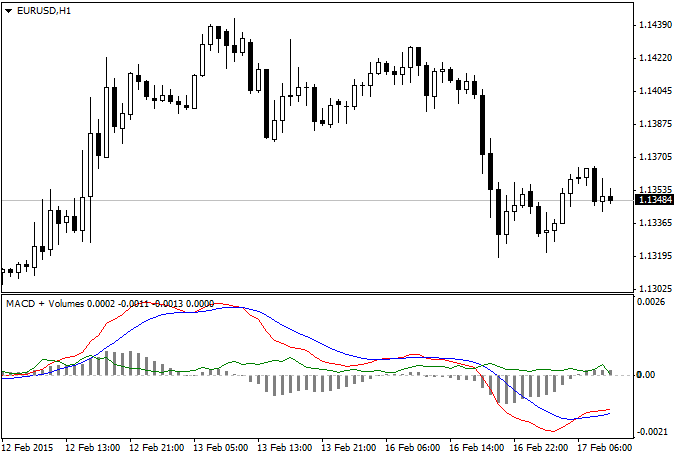
This forex - indicator has been done to find out MACD divergenсe\convergenсe and mismath between price and volume.
Full functional MACD lines and histogram, and you can turn off showing volumes whenever you want.

MACD and Volumes


Download forex-indicator

Saturday

Forex indicator gaps. Displays the price gaps between the bars timeframe selected during the period in days.
When dostyazhenii level (the ceiling gap) deletes level. Recommended setting range of at least 30 days.
essence of the indicator - the desire to cut prices of the price gap. Considered the levels are potential targets.
exception of levels formed by a hole in the quotations dealing centers and is not associated with a break at the moment of acceleration, etc.,
but to distinguish them from real break is almost impossible. Significant Parameters: Range of gaps - the number of analyzed days history The accuracy of the price - the number of digits after the decimal point in price


Forex indicators
Download the forex -indicator GapView

Tuesday

Multitimeframe indicators

It's very often there isn't enough time to check all chart timeframes and look for the best entry point, these indicators can be set in one window and not switching screens to see the whole picture together.
RSI:
Stoxastic:
The Stoxastic and RSI indicators are extremely simple, they show the values of relevant indicators with a candle a higher period. The details can be examined further using indicators MA.
Variables:
Total variable for all three indicators timeframe. The valyes are:
  • timeframe = January 1 minute
  • timeframe = May 5 minutes
  • timeframe = 15 15 minutes
  • timeframe = 30 30 minutes
  • timeframe = 60 1:00
  • timeframe = 240 4:00
  • timeframe = 1440 1 day
  • timeframe = 10080 1 week
  • timeframe = 43200 1 month
For the case if there is a mistake in minutes, the indicator itself correct, and set the desired period. For all other variables as well as in the original versions of the indicators.
Now back to MA.
Partly applied_price it can serve for many functions.
  • applied_price = 0 PRICE_CLOSE
  • applied_price = 1 PRICE_OPEN
  • applied_price = 2 PRICE_HIGH
  • applied_price = 3 PRICE_LOW
  • applied_price = 4 (high + low) / 2
  • applied_price = 5 (high + low + close) / 3
  • applied_price = 6 (high + low + close + close) / 4

For example, if you put in the window with a period of less than H1 immediately 3 indicators with the following parameters:
  1. PeriodMA = 1; applied_price = 2; timeframe = 60;
  2. PeriodMA = a; applied_price = 3; timeframe = 1960;
  3. PeriodMA = 1; applied_price = 0; timeframe = 15;

So we get an indicator showing the minimum and maximum hourly candles (green lines 1,2) and (Orange 3) shows the opening price of each 15-minute candles.

By varying the parameters, you can create right combination of indicators that can you.
Each indicator has two buffers. One is the main, which shows the value steps and support, a smoothing step.

Download multitimeframe indicators:
Multi.Period.RSI.mq4 
Multi.Period.Stochastic.mq4
Multi.Period.MA.mq4

Thursday

KillGap indicators


  You'll never catch myself wishing to take the scissors, cut befell after the holidays or weekends gap and glue quotes? ))) )))
  Forex indicators, once such a gap (which can be hundreds of items and more), fall in prostration (as much bent arrows) on the length of its calculation (for indicators with FIR).  For indicators with IIR all can be much worse. . In short, while "arrow does not straighten out, and the indicators will not be adequate, they will be at best useless, and sometimes can hurt.
 That's what happened with "scissors and paste.  On the schedule podtsepleny Envelops, RSI and ATR in two versions - c gepom (red) and without (blue).
Forex indicators
  For the intraday time-frame, this is not a systematic gap carries no information, but on the contrary - makes a malfunction indicator. You can simply count the history of this indicator re-Gap, but you can use the previous dogepovye quotes.  In any case, it is more acceptable than the presence of Gap in the original data.

  How to identify a "festive" gap?  It is obvious that it must meet two conditions:
1.  The time between adjacent bars should not be less than, say, eight hours.  If it does not take into account, in real-time gap may be incorrectly identified within the day - not uncommon for the quotes come from gepami, which then, in retrospect filter (filled) DC ..
2. The presence of the gap between the bar and Close Open previous.
  In order to build bezgepovye indicators need to have a source of filtered with a cut gepom quotes for all types of prices.  This auxiliary display KillGap, at 0-m buffer is - "glued" quotations on the requested type of price, and the 1-m - cumulative difference gepov - displacement, ensuring continuity.  Actually, the original still bezgepovoe Close Close , High Plus this shift, High без гэпа = High + смещение и т.д. without Gap = High + offset, etc.
iCustom ( 
string symbol, //  character name tool (NULL-current)
int timeframe, //  time-frame (0 - current)
"KillGap" , //  name of this indicator
//
int GapPoints, //  threshold identification Gap in paras. <0 - without filling a second buffer - offset
int GapHours, //  threshold on the time between adjacent bars
//  0 - in hours
//  <0 - in minutes
int applied_price, // type of prices:
//  0 - PRICE_CLOSE - the closing price
//  1 - PRICE_OPEN - open price
// 2 - PRICE_HIGH - maks.tsena
//  3 - PRICE_LOW - min.tsena
//  4 - PRICE_MEDIAN - the average price, (high + low) / 2
//  5 - PRICE_TYPICAL - typical price, (high + low + close) / 3
//  6 - PRICE_WEIGHTED - Weighted close price, (high + low + close + close) / 4
//  7 - the volume
// 
int mode, //  mode - buffer number indicator:
//  0 - buffer killgap quotes
// 1 - buffer bias - cumulative difference gepov
int shift //  int   shift
  ); ) 
If you throw it on the schedule, the process of "gluing" is seen clearly. (Don't gap closing price):

Suffice it to replace its code address to the price of an array to call this indicator the appropriate price type or add gepovoe offset (1-y buffer) to the original prices, it is better for speed, when the indicator is used several types of prices.
You can also prepare bezgepovye price arrays in advance of its conversion cycle (fragment f-uu start () of the stochastic - there should be just three types of prices and dalneshem features are used with arrays - ArrayMaximum (...)):
void start() { void start () (
//  Border conversion
int limit=Bars-IndicatorCounted()- 1 ; int limit = Bars-IndicatorCounted () - 1;
if (limit> 1 ) limit=Bars- 1 ; if (limit> 1) limit = Bars-1; 
//  Fill arrays killgap price
for ( int i=limit; i>= 0 ; i--) { for (int i = limit; i> = 0; i -) ( 
double base =iCustom(NULL, 0 , "KillGap" ,GapPoints,GapHours, 0 , 1 ,i); //  double base = iCustom (NULL, 0, "KillGap", GapPoints, GapHours, 0, 1, i);  get gepovoe shift
      CloseG[i]=Close[i]+ base ; // positioned Price CloseG [i] = Close [i] + base;  
      HighG[i] =High[i] + base ; //  search for a maximum price HighG [i] = High [i] + base;  
      LowG[i]  =Low[i]  + base ; // price of finding the minimumLowG [i] = Low [i] + base;  
     } ) 
In order to properly display indicators risuyuschihsya in tool window (price), count them on killgap quotes values should be shifted by the value of Gap in the opposite direction (code f-uu start () indicator iMA. Gap):
void start() { void start () (
//  Border conversion
int limit= Bars -IndicatorCounted()- 1 ; int limit = Bars-IndicatorCounted () - 1;
if (limit> 1 ) limit= Bars - 1 ; if (limit> 1) limit = Bars - 1; 
//  Buffer bezgepovymi quotes and displacement
for ( int i=limit; i>= 0 ; i--) { for (int i = limit; i> = 0; i -) (
      price[i]= iCustom ( NULL , 0 , "KillGap" ,GapPoints,GapHours,Price, 0 ,i); //  price [i] = iCustom (NULL, 0, "KillGap", GapPoints, GapHours, Price, 0, i);  quotes
      base[i] = iCustom ( NULL , 0 , "KillGap" ,GapPoints,GapHours,Price, 1 ,i); // смещение base [i] = iCustom (NULL, 0, "KillGap", GapPoints, GapHours, Price, a, i); / / shift
     } )
//  Calculate the indicator of the array price []
for (i=limit; i>= 0 ; i--) Ind[i]=iMAOnArray(price, Bars ,MAperiod,Shift,Method,i) -base[i] ; for (i = limit; i> = 0; i -) Ind [i] = iMAOnArray (price, Bars, MAperiod, Shift, Method, i)-base [i];
  } ) 
You may also implement a code indicator KillGap in reworks indicator in the form of a function, but for speed (check) win not noticed.

In the attached archive contains:
KillGap - light source dont gap quotes and displacement
killgap indicators:
iATR.Gap - the average trading range
iBands Gap - Bollinger Bands
iCCI.Gap - Commodity Channel Index
iEnvelops.Gap - envelope
iMa.Gap - Moving Average
iMomentum.Gap - Momentum
iRSI.Gap - Relative Strength Index
iStdDev.Gap - standard deviation
iSAR.Gap - Parabolic
iStoch.Gap - Stochastics
iStoch.GapNR - Stochastics with noise reduction

All indicators are the same fields as their standard prototypes, except for the added field GapPoints Gap identification threshold in points. Временной гэп во всех случаях жестко установлен в 8 часов. Time gap in all cases rigidly fixed at 8 o'clock.  int If you are interested pofiltrovat gepy within the day, you can do in the code indicator of the global variable int GapHours GapHours внешней, т.е. extern external, ie extern int int GapHours . GapHours.  But this makes little sense - gepy within days then usually filtered dealing centers.

Download killgap forex indicators

Saturday

Indicator MA-Hector


The idea of this forex indicator is taken from Hector (Hector DeVille).
Use a simple Moving Average (MODE_SMA, PRICE_CLOSE) for all periods platform and with a period of 30, 50 and 100.
If the MA-50 is higher than the MA-100 MA-30 is higher than the MA-50 and the current candle for all the parameters higher than the MA-30, the indicator gives a signal "BUY" for the relevant period. И наоборот. And vice versa.

Forex 
indicators

  Download Forex Indicator MA-Hector

Friday

Indicator MultiInfo


This forex indicator reflects the tendency of currencies in five pairs.  The idea was inspired by the recent indicator of "flight" of the yen all of its couples - sometimes you want to look at the overall trend of the currency.  Put to any schedule.
In the external variables chosen currency (by default EUR) and watch 5 pairs of this currency.
  • MACD - it TrendMACD,% depends on the acceleration trend (not calculated).
  • Yellow Stoch or RSI means that it is in the extreme values and trust him not worth it.
  • If the RSI and Stoch to 00 - your DC does not work with this pair.
Forex indicators

Download forex indicator MultiInfo

Thursday

Indicator of relative strength of currencies


Both forex indicator work together on a pair of "EURUSD".
Forex Indicator EUR_2bL draws candles on the average euro and shows the current price of "Eur-Close".
Forex Indicator USD_2bL draws candles on the average dollar and shows the current price "Usd-Close".  If you enable "extern bool Fibo = true", the indicator will draw the line Fibonacci, based on two prices: "Eur-Close" and "Usd-Close".
Collaboration of two indicators show the relative "strength" of currencies (in this case, EUR and USD).

Forex indicators
 Download forex indicator of relative strength of currencies: USD_2bL.mq4 EUR_2bL.mq4

Indicator Time Jerk


The histogram shows the movement:
  Blue Movement   Close to one point up a red traffic at one point down (Subject to Delay).
Violet curve - this time changing Close (see> 0 and <0 for convenience).
Forex indicators


Parameters:
window - the window size to display this forex indicator (window display always normalized to the largest value of time window).

  Delay (value in seconds) - Ignored if passed between the Close time greater than or equal Delay (value histogram = 0, time value curve is not displayed until the emergence of non-zero histogram (DRAW_SECTION)).

Forex indicators

Download Forex Indicator Time Jerk

Monday

Indicator Momemtum In Time


This forex indicator shows the price movement relative to a chosen time point (zero line). As a reference point used the opening price of the day.  Well, it is clear that using this forex indicator should be on the ТF at least 4 hours.
The indicator used by the strategy of the book by Larry Williams' "Long-Term Secrets Short-Term Trading.

Range - it's all the distance traveled by an asset during the day, week, month, year - maybe even one minute. Think of the range as the distance traversed at any price you have studied time period.
For small bands, followed by big bands, big bands, followed by a small range.  It's like clockwork and its main key to profitable short-term trading.
Do not need no fortune teller, to inflate the existing facts or pull their ears.  What is - that is, always was and always will be - we constantly receive sig nal of the lucrative bars with different large range, thanks to earlier warnings from the small ranges.
An absolute truism on days with a large range: the days verhnenapravlennyh large ranges usually open close to the minimum and close close to the maximum.  Days large open ranges close to the maximum of the day and closed down close to the minimum.
  This means: in their trade, you should take into account two things.  First - if we go up "on board" the day when, as we think will be a big range, it is not looking for a point of purchase is far below the opening.  Days of big bands rarely verhnenapravlennyh protorgovyvayutsya far below the opening price of the day.  This means: you do not have to look for the possibility of buying substantially below the opening price.
Likewise, if you think you have caught a tiger by the tail - but just such an opportunity is given the day with a large range - at that time, as the price falls significantly below the opening, the probability of a large upward movement is greatly reduced.
This is a very important point in studying the secrets to profitable short term trade.  Do not discard it.
  1. Do not try to buy during large price fall below the opening.
  2. If the position is long (long) and the price falls significantly below the opening, go to the market.
  3. Do not try to sell in large jumps above the opening price.
  4. If the position is short  and the prices go much higher than the opening, go to the market.
Sometimes you'll see the days with a large range, strolling on both sides of the opening price, but this is the exception, not the rule.
" Do not try to argue with these rules, they reflect the laws of gravity. "

Larry Williams

Forex indicators


Download forex indicator Momemtum In Time

Indicator Fractial Period


This forex indicator does not differ across the fields of parameters, the smoothing method and the types of prices from the standard iMa , but allows the use of fractional period and shift.
double iCustom ( 
string symbol, //  string symbol, / / character name tool (NULL-current)
int timeframe, //  time-frame (0 - current)
"iFMA" , //  name of this indicator
 double period, / / period MA; m.b.drobnym (> 1) and in the form of ratio-ta (<1)
 double ma_shift, / / shift MA;  fractional (0)
int ma_method, / / method of averaging:
// 0 - SMA (simple)
// 1-  EMA (exponential)
// 2 - SSMA (smoothed)
// 3 - LWMA (linearly-weighted)
int applied_price, //  type of smoothed data:
// 0 - Close, 1 - Open, 2 - High, 3 - Low,
// 4 - Middle = (High + Low) / 2 (medium)
// 5 - Typical = (High + Low + Close) / 3 (typical)
// 6 - Weighted = High + Low +2 * Close) / 4 (weighted)
// 7-  Volume (volume)
0 , //  mode - buffer number indicator (0)
 int shift / / shift
   ) ) 
It features a field type and period ma_shift (double instead of int) and added a modifier for the field applied_price - 7 (volume).
In addition, the added possibility rather than the period entered the coefficient (> 0 ... <1), which allows fully matched to EMA .  For example, initially MACD on DiNapoli use coefficients for the fast and slow EMA , which very roughly translated to periods in MT due to their integer.  Options MACD DiNapoli: fast EMA - ratio.  0,213 - the period of 8.39, slow - 0.108 - 17.52, whereas in the MT are given by periods of 8 and 17, respectively.
If we introduce the coefficient of the other averaging method, it will be counted in the period.  And since the period may be in this forex indicator nonintegral, then the MA will be calculated based adequately in any case - or a non-integral period obtained from the conversion.  So it is absolutely unimportant, you enter in the field MAperiod, say, a factor of 0.1 or a period of 19 - the same result.
The picture shows the SSMA (3) - red, SSMA (3.6) - Green, SSMA (2.33) - blue.
Forex indicators

  Note that for SSMA (3) instead of period 3 introduced a coefficient of 0.5, which was successfully converted into the period and displayed in the window of data.  This, of course, taken as an example of the use of factors other than those types of EMA MA. Можно (и логичней) для SSMA было ввести 3 с тем же результатом. You can (and logical) for the SSMA to be introduced in March with the same result.
By the way, SSMA - smoothed moving average (on another are called "smoothing Wilder" - Wilder's smoothing) absolutely painlessly may be replaced by ordinary EMA, which is calculated as the period 2 * Period SSMA -1.  That is, SSMA (12) will be exactly the same as the EMA (23) at a sufficient history (> 4 periods).

Download forex indicator Fractial Period

Saturday

Indicator Cynthia Case


This forex indicator is stochastics , built on the basis of "psewdoweek" bars.
In general terms, the trading system Cynthia Case can be read here

Indikatry forex
 
 Download forex indicator Cynthia Case

Thursday

Indicator AsimmetricStohNR


It is assumed that readers know the parts of a normal stochastic . By using the TS will also be worthwhile to read the article by M. Korolyuk (Moishe) Tortoise - it sounds proud .
In the fields of parameters in asymmetric Stochastics only three differences from the standard:
K period now consists of two - younger KperiodShort (short) and senior KperiodLong (long).  Another added option oversold level (PP) OverSold, which calculates the level of overbought (PC). Enter stochastics in the zone PC / PP switches Kperiod'y - the length of the search of maxima / minima.  The third difference - the threshold of sensitivity - a parameter Sens.
The logic works s:
If stochastics dropped into a zone of PP, then search for the minima occur for younger Kperiod (KperiodShort) bars, while the maximum - for the senior (KperiodLong).  When entering a zone PC - mirror - minima are searched for a longer interval, maximum - in short.
Interpretation / use (and do not necessarily consciously))).  Sunset stochastics in the area of PC / PP means switching trend in direction.  But! Switching the trend is not meant opening a position in his direction in the general case.  Enter is on the correction, which can be identified by crossing / touching the line of 50%.  If roughly follow the "Turtle" - pose pursued, with the correction. При переключении тренда происходит или полное закрытие позы, или ее сокращение. When switching trend occurs or complete closure of the position or its reduction. In the latter case, a complete closure is already on the correction with simultaneous opening of the opposite.  Stop-loses are set by the previous (opposite) peak with reasonable indentation.  However, their activation in the working mode is unlikely.  Stops here to force majeure.
Н But it's all so - from the bulldozer. Tactics do not impose.
In the first pane - asymmetry stochastics in the second - normal.
 
Forex indicators


Call of the codes, the input parameters and destination buffers:
iCustom( iCustom ( 
    NULL,0,"AsimmetricStochNR",  //  at the current time frame and tool 
    KperiodShort,              //  Junior (short)% K 
    KperiodLong,               //  Senior (long)% K 
    Dperiod,                   // %D signaling Dperiod, 
    Slowing,                   // slow Slowing,  
    Dmethod,                   //  MA type of signal: 0-SMA, a-EMA 
    PriceField,                //  type of price: 0-High/Low; 1-Close/Close 
    Sens,                      //  sensitivity in paras. 
    OverSold,                  //  level of PP in%% 
    N,                         //  buffers: 0 - main, 1 - signal 2 - Trend 
    i                          //  shift  i   

Download forex indicator AsimmetricStohNR